Welcome to the Onshape forum! Ask questions and join in the discussions about everything Onshape.
First time visiting? Here are some places to start:- Looking for a certain topic? Check out the categories filter or use Search (upper right).
- Need support? Ask a question to our Community Support category.
- Please submit support tickets for bugs but you can request improvements in the Product Feedback category.
- Be respectful, on topic and if you see a problem, Flag it.
If you would like to contact our Community Manager personally, feel free to send a private message or an email.
How to get a series data from measurement?
 roy_yang375
Member Posts: 13 PRO
Hi All,
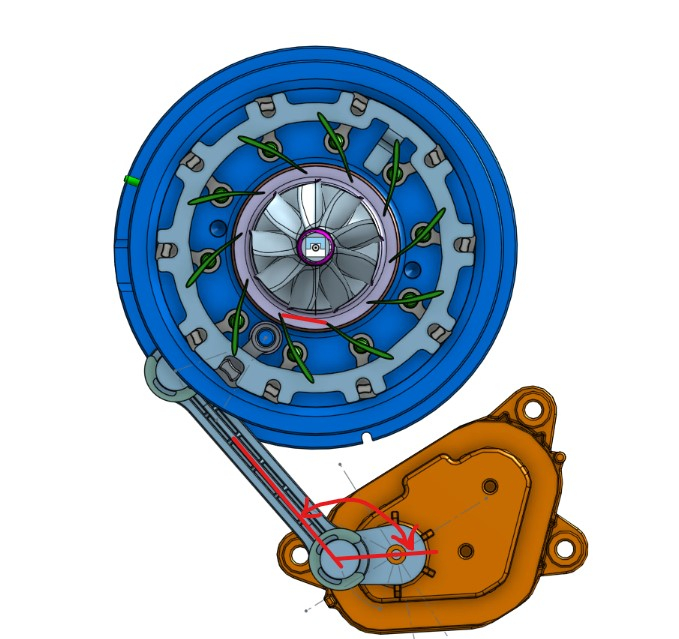
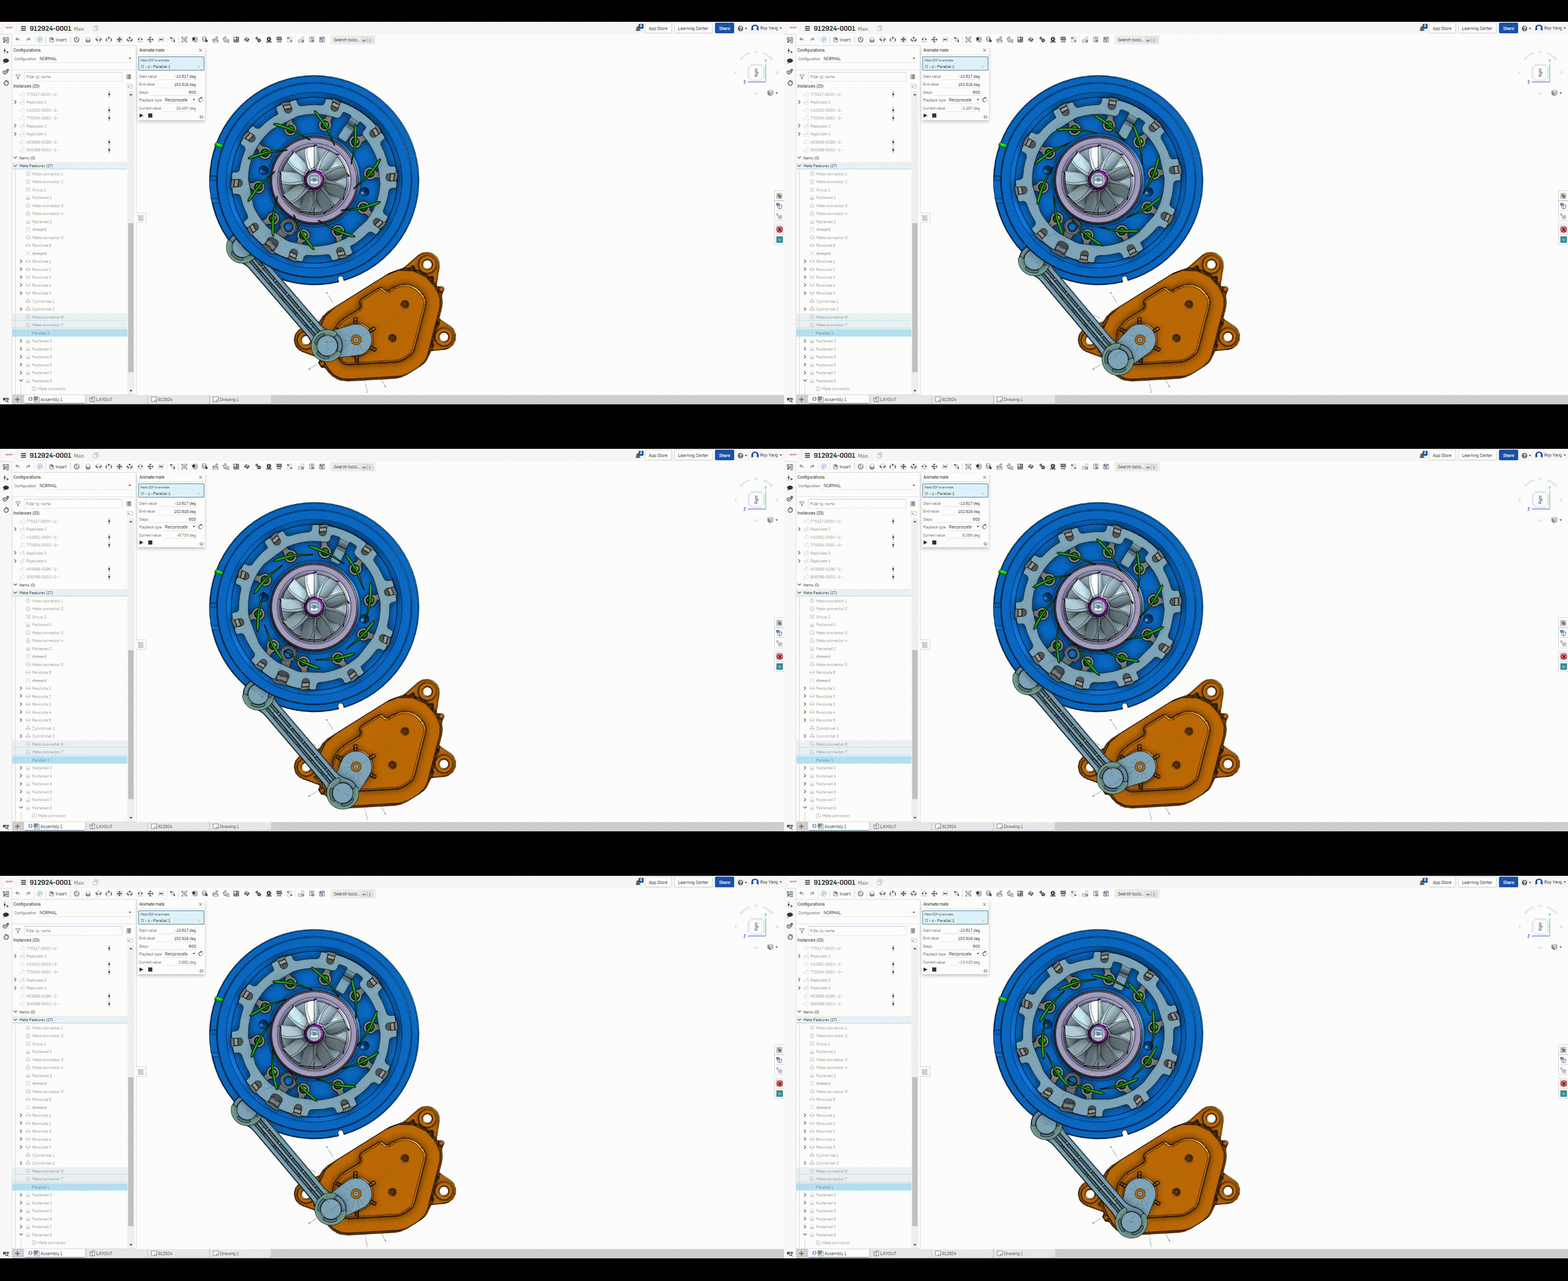
I would like to make a scatterplots represent a movement relation which about the distance between vane to vane, and the angle of rod.
Now the problem is how to get the measurement automatically rather than manually?
I mean maybe its not smart if I have to measure them one by one to get more than 15 sets of data.


Tagged:
0
Best Answers
-
 konstantin_shiriazdanov
Member Posts: 1,221 ✭✭✭✭✭
This type of study now worth to make in part studio, there are no automation for this in assembly. Check this Tracer feature. It creates dependency plot and prints array of points in the console
1 -
 GregBrown
Member, Onshape Employees, csevp, pcbaevp Posts: 375
  As mentioned above, a great approach will be to have a part studio where there are sketch(es) that create the layout that drives the motion. In fact I've been working on a methodology I'll share the bare bones of here for precisely the same use case... (This is a way, not the way to do it.)
I have a sketch that is nicely behaved (i.e. constrained well) and is driven by a particular dimension. In this case it is a four bar linkage. driven by the base angle on the left.
Notice that I created a configuration variable and assigned its value to the dimension in the sketch.
I have used the Onshape custom feature called Measurement and Variables to create 3 measurements and assign their values to variables. This is key to the way I'm using the api to extract values. More on this in a bit.
Now, to the dev-portal to create an API key-pair, and an OAuth application (---that part not described here---)
I love using Google Sheets for many things, including this example. So I created a Sheet and then in the Extensions menu, I created an Apps Script
In the Apps Script I've used the OAuth and Onshape api's (details not described here) to create some simple functions that set and get variables in a given Onshape part studio. This function manifests itself as a custom function in my Sheet. (See below for a snippet of my code for one of my functions)
So just like for a common built-in summing function you might type=SUM(A1:Z1)
my custom function allows you to type=OS(did, wvm, wvmid, eid, {configuration} )and it returns to me an array of all the variables that I've defined in the Part Studio. Cool. Now that these returned values are in cells in my Sheet, I can do whatever I need to do: plotting etc... And because this is a custom function, I can use the fill-down technique to apply this function to a whole array of inputs.
Here's a look at my Sheet: (the yellow cells show inputs, in this case the url of the Onshape doc, and the range of input angles 0-170deg. The green cells show the returned values, including the variable names.
OK so I realize this might be hard to follow if you haven't played much with Onshape's api's, but it is actually much less intimidating than you might think. There are resources to get you started with some of these concepts, but for a rough proof of concept I'd be happy to hear what you think.
Footnote: This trivial example has only one config variable and a couple of outputs. But in reality you might have a highly configured part studio with many config variables and/or config lists... The ability to specify the fully configured state of the part studio with one api call is... powerful.4
Answers
Thank you.
I have a sketch that is nicely behaved (i.e. constrained well) and is driven by a particular dimension. In this case it is a four bar linkage. driven by the base angle on the left.
Notice that I created a configuration variable and assigned its value to the dimension in the sketch.
I have used the Onshape custom feature called Measurement and Variables to create 3 measurements and assign their values to variables. This is key to the way I'm using the api to extract values. More on this in a bit.
Now, to the dev-portal to create an API key-pair, and an OAuth application (---that part not described here---)
I love using Google Sheets for many things, including this example. So I created a Sheet and then in the Extensions menu, I created an Apps Script
In the Apps Script I've used the OAuth and Onshape api's (details not described here) to create some simple functions that set and get variables in a given Onshape part studio. This function manifests itself as a custom function in my Sheet. (See below for a snippet of my code for one of my functions)
So just like for a common built-in summing function you might type my custom function allows you to type
=OS(did, wvm, wvmid, eid, {configuration} )and it returns to me an array of all the variables that I've defined in the Part Studio. Cool. Now that these returned values are in cells in my Sheet, I can do whatever I need to do: plotting etc... And because this is a custom function, I can use the fill-down technique to apply this function to a whole array of inputs.Here's a look at my Sheet: (the yellow cells show inputs, in this case the url of the Onshape doc, and the range of input angles 0-170deg. The green cells show the returned values, including the variable names.
OK so I realize this might be hard to follow if you haven't played much with Onshape's api's, but it is actually much less intimidating than you might think. There are resources to get you started with some of these concepts, but for a rough proof of concept I'd be happy to hear what you think.
Footnote: This trivial example has only one config variable and a couple of outputs. But in reality you might have a highly configured part studio with many config variables and/or config lists... The ability to specify the fully configured state of the part studio with one api call is... powerful.
By the way, It seems the second hardest portion is to simulate the assembly in the sketch. Because of the arm and vane, they are tangent contact. The arm would contact against the inside of the ring to drive it rotate. And strictly speaking, the Arm would contact another side after it reach the hard stop thus the ring would turn anticlockwise.
In this case I have to simplify the question and adjust the constrain relation to measure the data manually due to the time limit.
Sadly, the result looks like below...